Enter Password
Turning fragmented operational data into story-driven decisions
Role
Product Designer, UX Strategy
& Research
Company
Reviver
Time Frame
90 Days
01 - Overview
The situation in two sentences
OLIVAI automated quality control across a network of managed sites. In doing so, it generated 10× more data than the existing dashboard was built to handle. Critical operational signals were buried in noise, managers were slow to act, and the CEO had a 90-day deadline to fix it with AI.
My job was to figure out what "fix it with AI" actually meant for real users in real environments, and to ship something that worked within every constraint we had.
"Site Pulse became the blueprint for how data and AI initiatives are designed across the organization."
02 - The Problem
More data, less clarity
OLIVAI's quality control automation was working. The problem was everything downstream of it. As the system scaled, it produced exponentially more data, but the existing dashboard wasn't built for that volume. There was no prioritization, no narrative structure, and no clear path from signal to action.
Managers were spending more time trying to interpret the data than acting on it. They'd open the dashboard, scan a wall of metrics, and leave without a clear next step. The tool was generating information but not enabling decisions.
Business Problem
Signal buried in noise
A 10× increase in automated data volume overwhelmed the existing dashboard. Critical signals (staffing issues, quality flags, financial variances) were invisible until it was too late to act.
User Problem
No path from data to decision
Managers operated in high-pressure, time-constrained environments. They needed to move from "something happened" to "here's what I should do" quickly. The current system made that nearly impossible.

03 - The Ask
A 90-day mandate to build an AI product
The CEO's vision was clear and ambitious: managers should be able to get answers and direction through conversation alone. No charts, no manual analysis, no dashboards. I facilitated early alignment with leadership to translate that vision into measurable goals.
01
No path from data to decision
Managers operated in high-pressure, time-constrained environments. They needed to move from "something happened" to "here's what I should do" quickly. The current system made that nearly impossible.
02
Shorten issue-to-resolution time
Once a problem was identified, the tool needed to surface clear next actions, not surface-level alerts that sent managers on a separate investigation.
03
Establish OLIVAI's standalone product identity
Beyond the feature, the CEO wanted OLIVAI to have its own brand and design language, a foundation that could scale across future AI-driven capabilities.
04 - Discovery
Expanding the problem before narrowing the solution
Before a single wireframe, I needed to understand what was actually feasible and where the real risks were. I kicked off a cross-functional alignment workshop to pressure-test the CEO's vision against engineering realities, user behavior, and timeline constraints.
Technical constraint: the data wasn't ready for open-ended AI
Engineering could support approximately 100 predefined question-and-answer scenarios within the 90-day window. The underlying data was inconsistently tagged across modules, making true open-ended querying infeasible in this cycle. The AI had to be guided, not open-ended.
Behavioral risk: would managers actually use chat?
The same managers who couldn't find signals in the existing dashboard were being asked to switch to a conversational interface. We had no evidence they would. This became the central behavioral bet we needed to validate before committing to a direction.
Environment risk: the real world was noisier than the vision assumed
Managers weren't sitting at a desk with time to explore. They were on-site, handling escalations, checking data in 30-second windows. Any solution that required mental effort before delivering value would be abandoned, regardless of how well it was designed.
05 - Execution Model
Building a parallel process to beat the clock
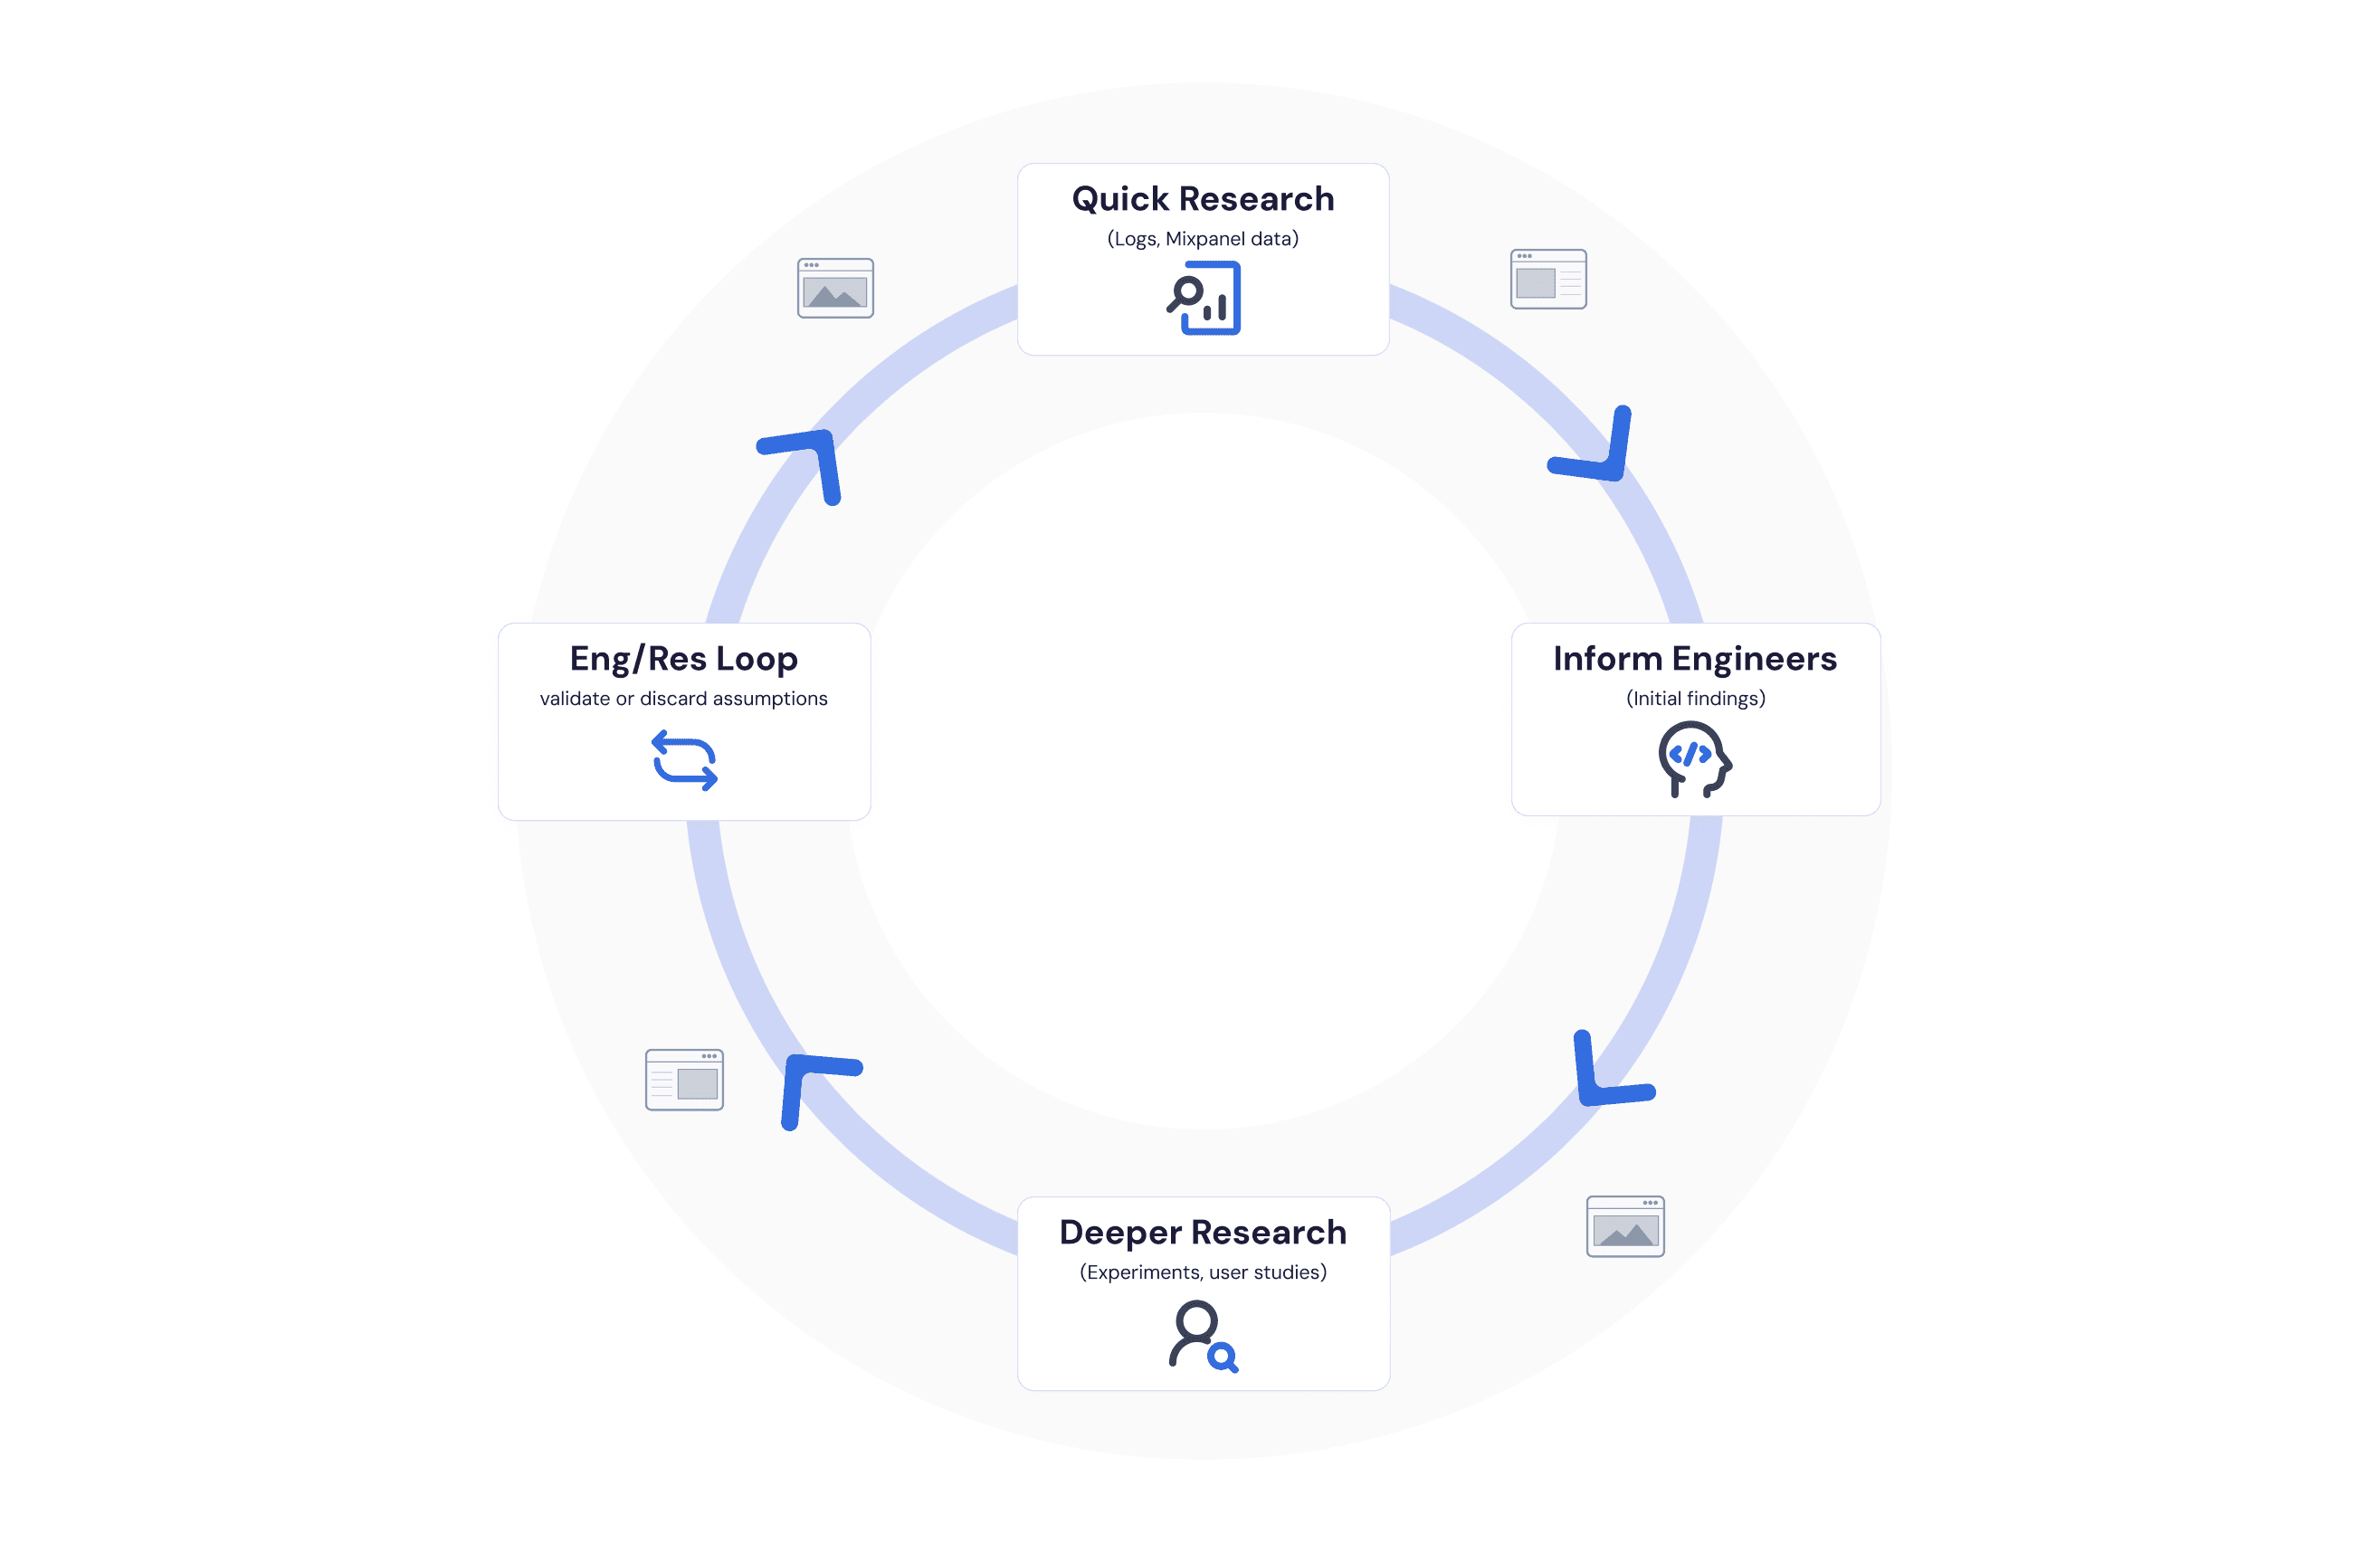
A 90-day timeline with this level of ambiguity meant sequential handoffs would kill us. I designed an execution model that allowed design, research, and engineering to move simultaneously, each informing the others without blocking them.
The structure: directional research set early constraints, engineering validated feasibility in parallel, and iterative testing refined assumptions before we committed to build. Design explored continuously across the entire loop rather than waiting for research to conclude.
06 - Research & Findings
What the data said vs. what the environment demanded
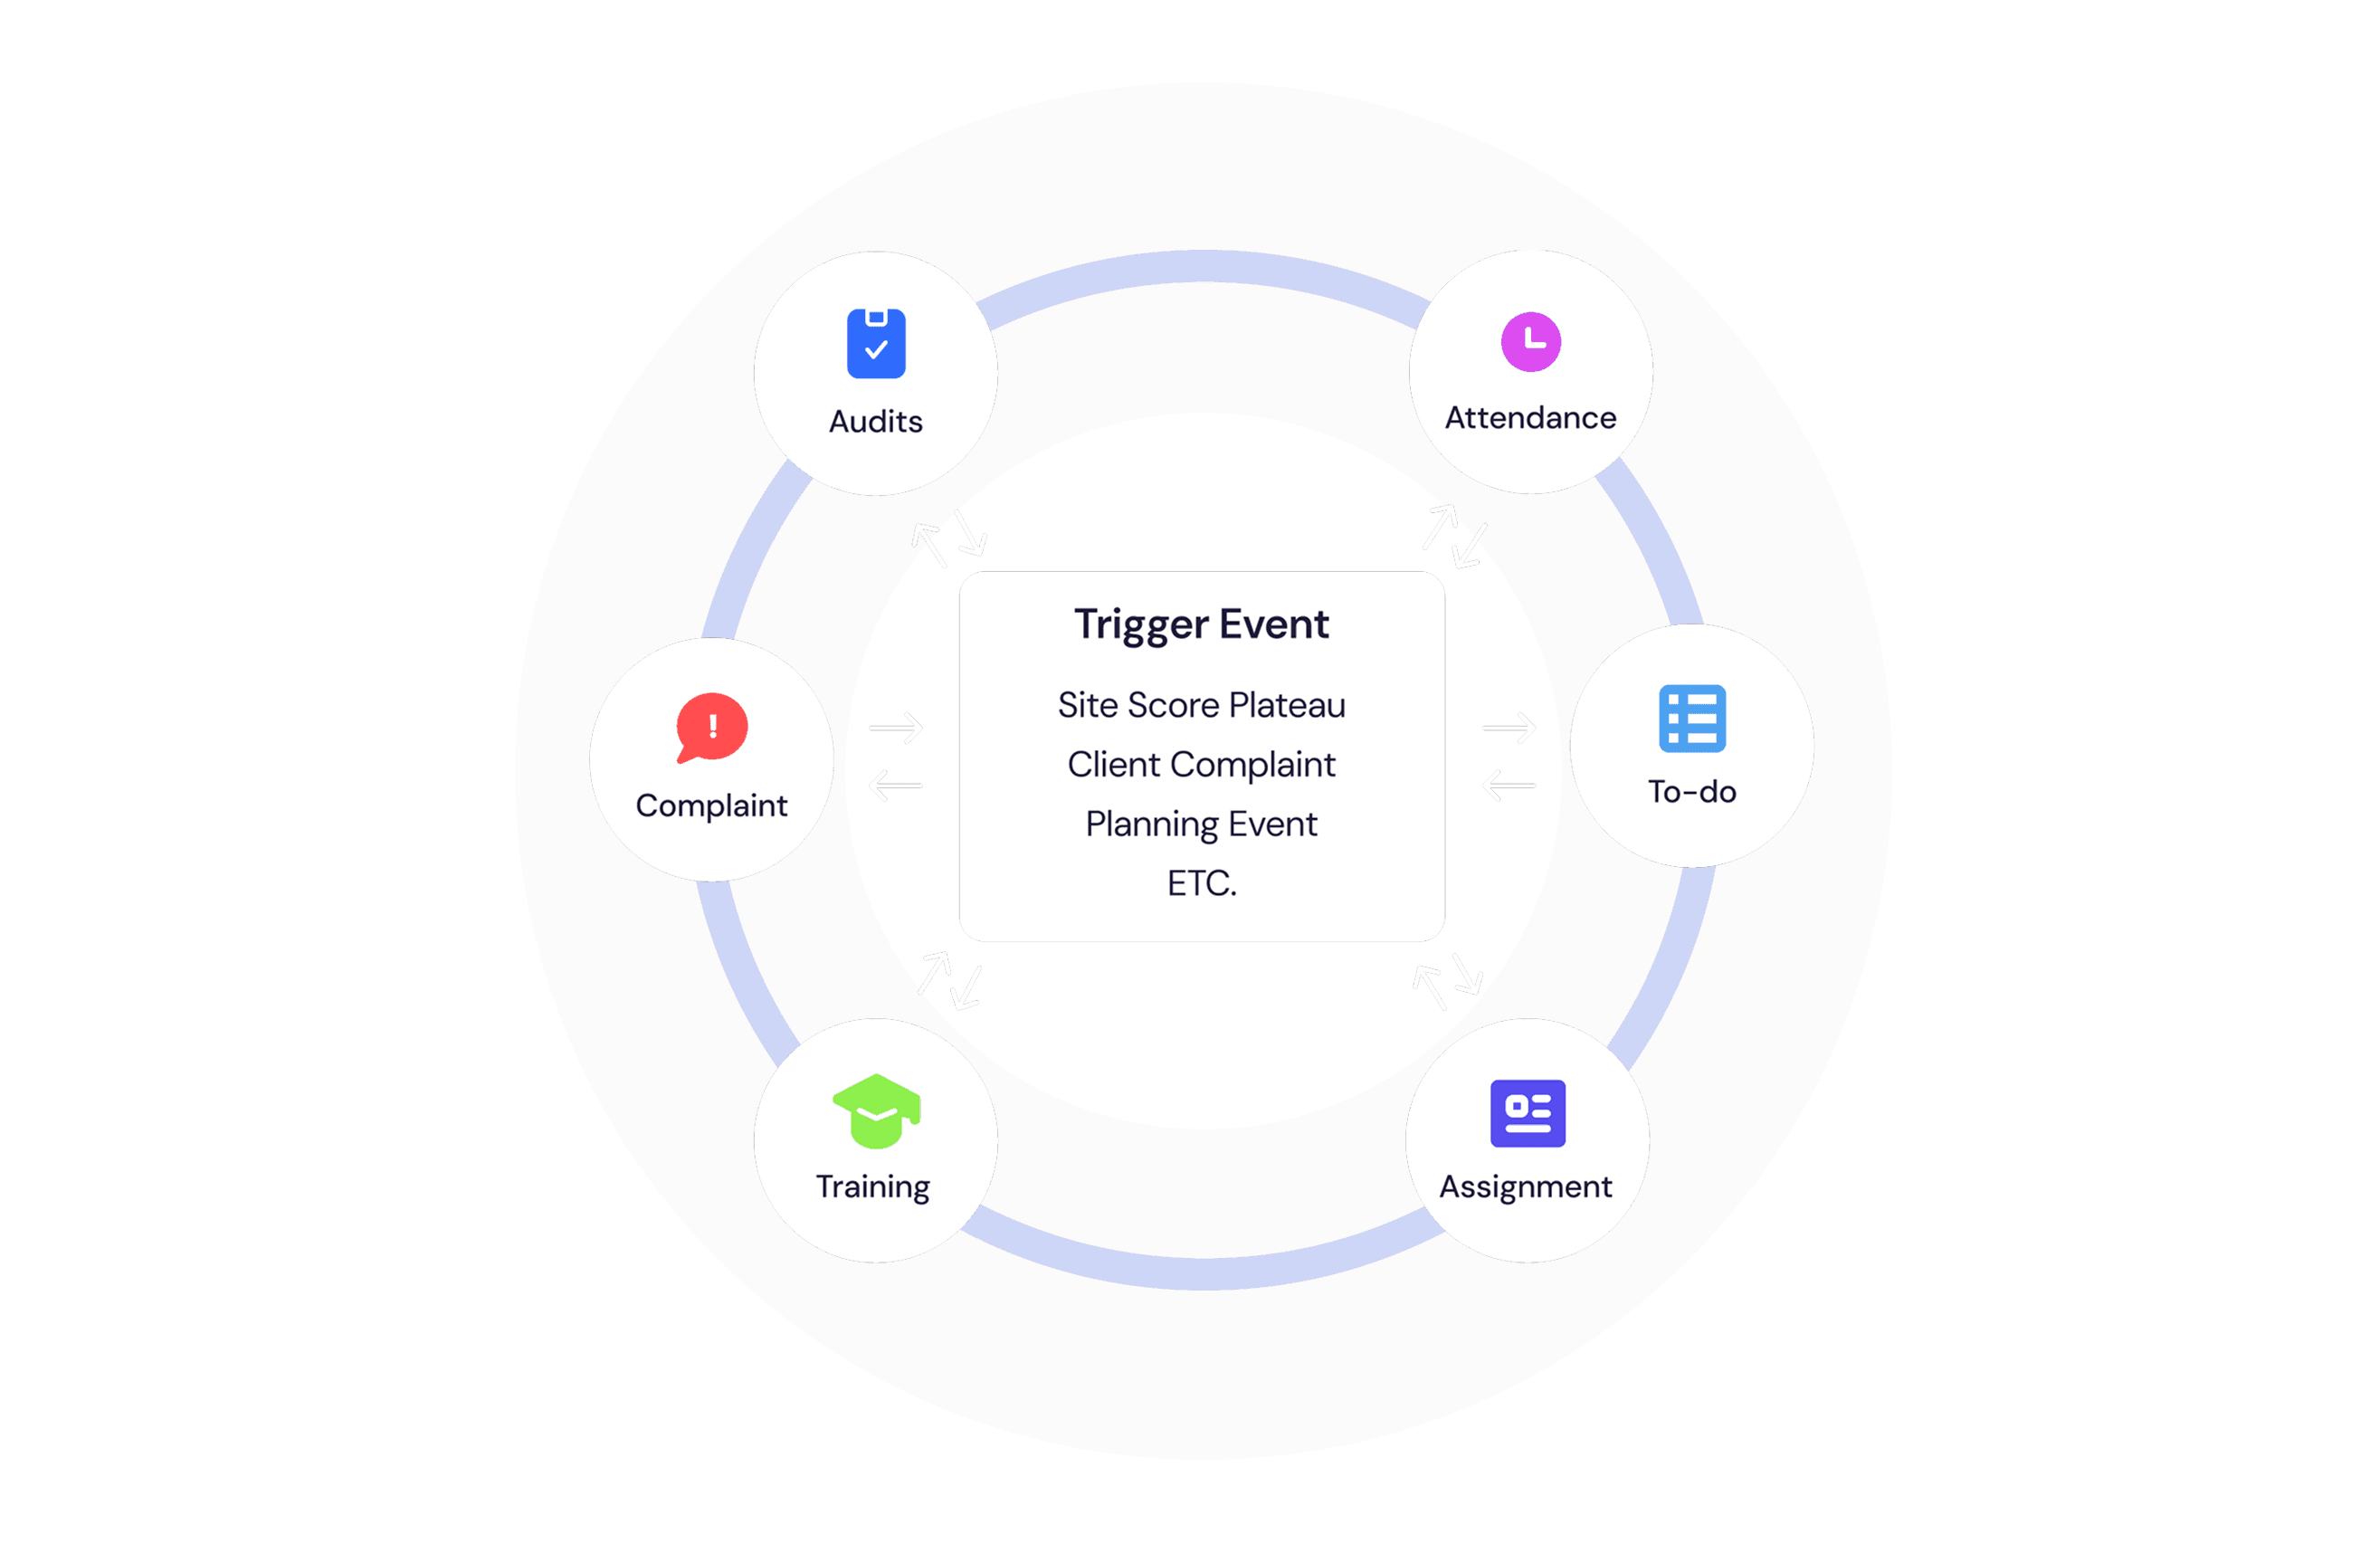
Early research suggested chat could work. Managers' natural behavior mapped to a consistent mental model: they always started from a trigger, moved to understanding a scenario, and then looked for a decision. That pattern fit comfortably within a chat framework.
But the real-world environment told a different story.
Finding 01
Consistent mental model
91% of managers applied the same trigger → scenario → action pattern, before being shown any structured alternative.
Finding 02
Chat slowed decisions
In noisy, high-pressure conditions, unstructured chat required cognitive effort before it delivered value, adding friction at exactly the wrong moment.
Finding 03
Speed matters more than flexibility
Managers didn't need the ability to ask anything. They needed the most relevant answer immediately, without having to formulate the question first.
07 - Concept Exploration
Three concepts across a spectrum of tradeoffs
Research findings put me in conflict with the CEO's vision. Rather than presenting a single recommendation that risked a standoff between design judgment and executive instinct, I designed three concepts that each represented a different position on the spectrum from vision-led to behavior-led.
The goal wasn't to pick a winner in the room. It was to shift the conversation from opinion to evidence, with comparative validation as the most rational next step.
Concept A - Vision-led
Chat-first interface
Conversation as the primary entry point. Closest to the CEO's original vision. Maximum flexibility, but required users to know what to ask.
Concept B - Hybrid
Chat + structured stories
Chat as the entry point, with pre-built story cards that collapsed into view as users scrolled. Balanced vision with behavioral reality.
Concept C - Behavior-led
Story-first dashboard
Pre-structured narrative summaries aligned to the user's mental model. No open-ended input required. Designed for the real environment, not the ideal one.
"The presentation reframed the decision. Leadership approved comparative validation, and that's when the data took over."
08 - Validation
Testing through decision behavior, not preference
I designed the validation experiment to measure the quality of decisions, not whether users liked the interface. That meant observing speed, confidence, and friction across identical scenarios using each concept.
The framework mirrored how managers actually make decisions: event-driven, time-constrained, and action-oriented.
Test Method 01
Unmoderated scenario modeling
Same operational scenario, different concepts. Measured time-to-identify, time-to-understand, and time-to-choose-a-next-action per concept.
Test Method 02
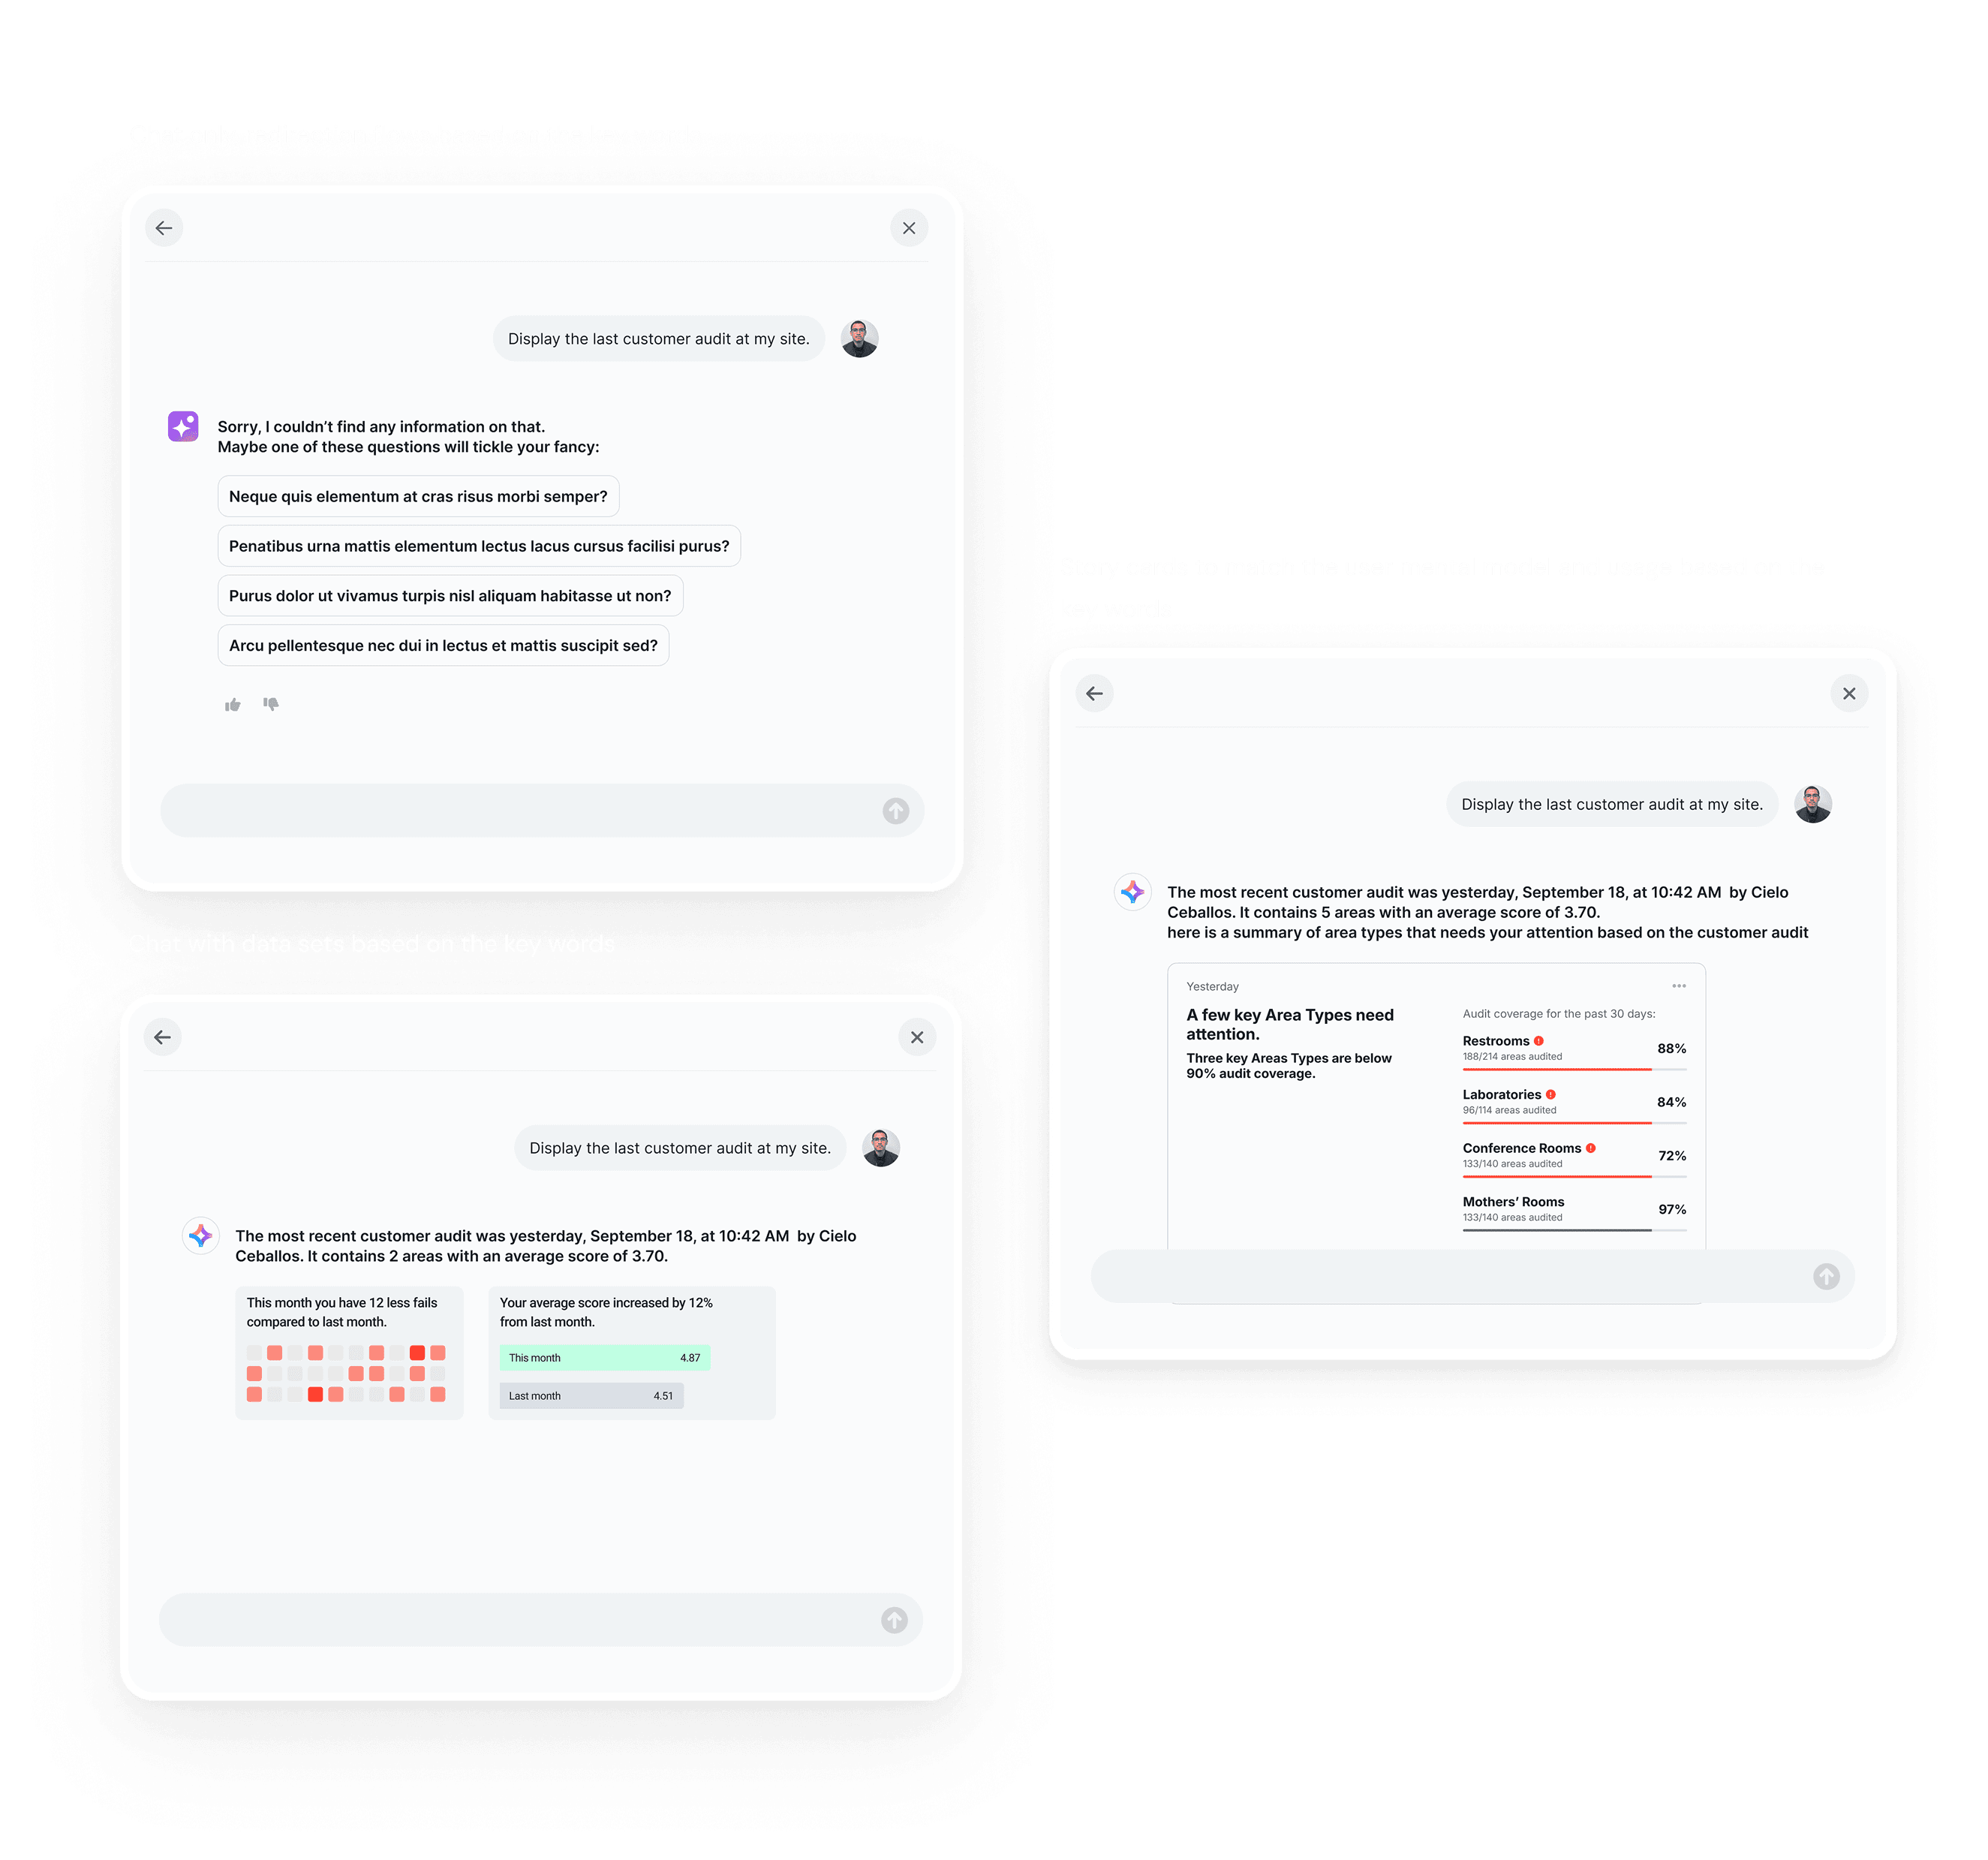
Q&A quality checks
Same questions, same data set, all three concepts. Compared accuracy, response speed, and confidence to act.
Test Method 03
Qualitative cross-checks
Side-by-side session review. Observed hesitation patterns, backtracking behavior, and whether users completed the decision loop.
Key Finding
Structured stories won on every metric
Faster decisions. Less hesitation. Higher completion rates. 80% of users oriented to the pre-built story cards immediately, with no training required.
09 - The Solution
A hybrid that honored the vision and respected the data
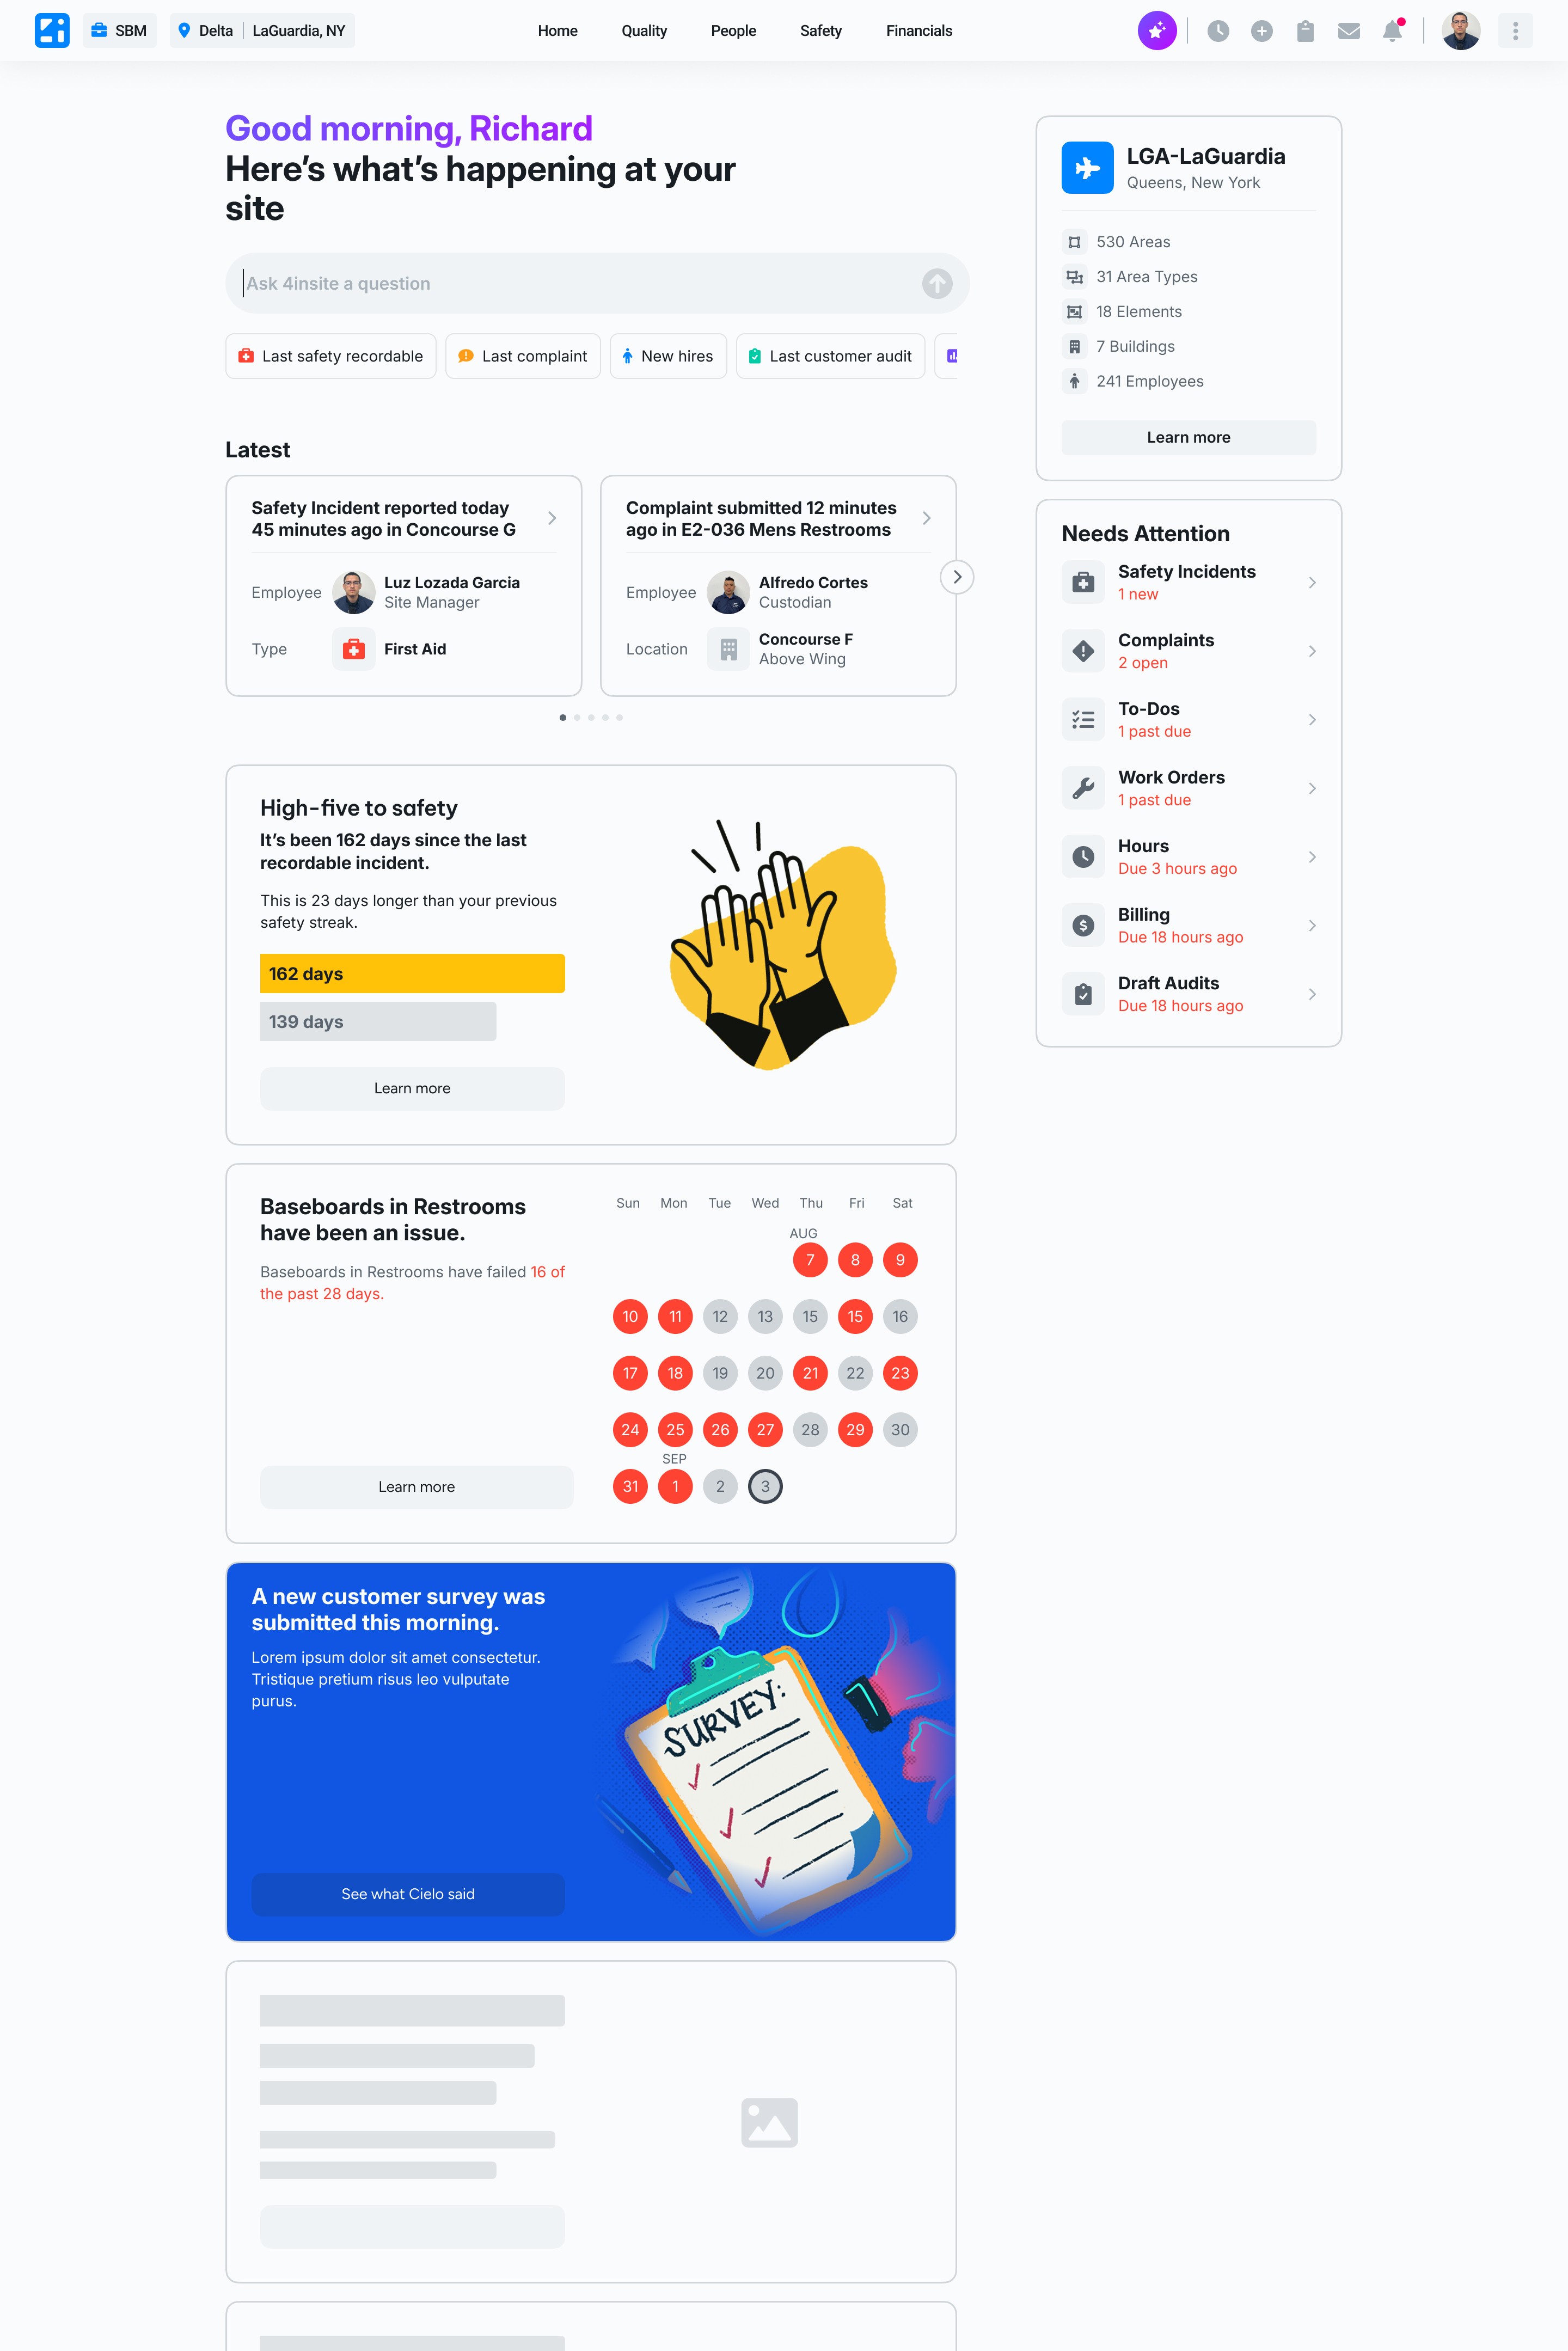
I evolved the strongest concept into a production design that kept chat alive as an entry point, without forcing users to rely on it. As managers scrolled, the interface collapsed into pre-built story cards that surfaced context, signals, and next actions in one view.
The result was an experience that matched the CEO's vision on the surface, and the user's actual mental model underneath.
01
02
03
Structured story cards
Narrative summaries built around the trigger → scenario → action mental model. Pre-structured, role-aware, and surfaced without requiring a query.
03
Needs Attention CTAs
Benchmarked, role-specific next actions that replaced the open-ended question "what should I do?" with a direct, contextual answer.
10 - Design System
A new product identity without a full rebuild
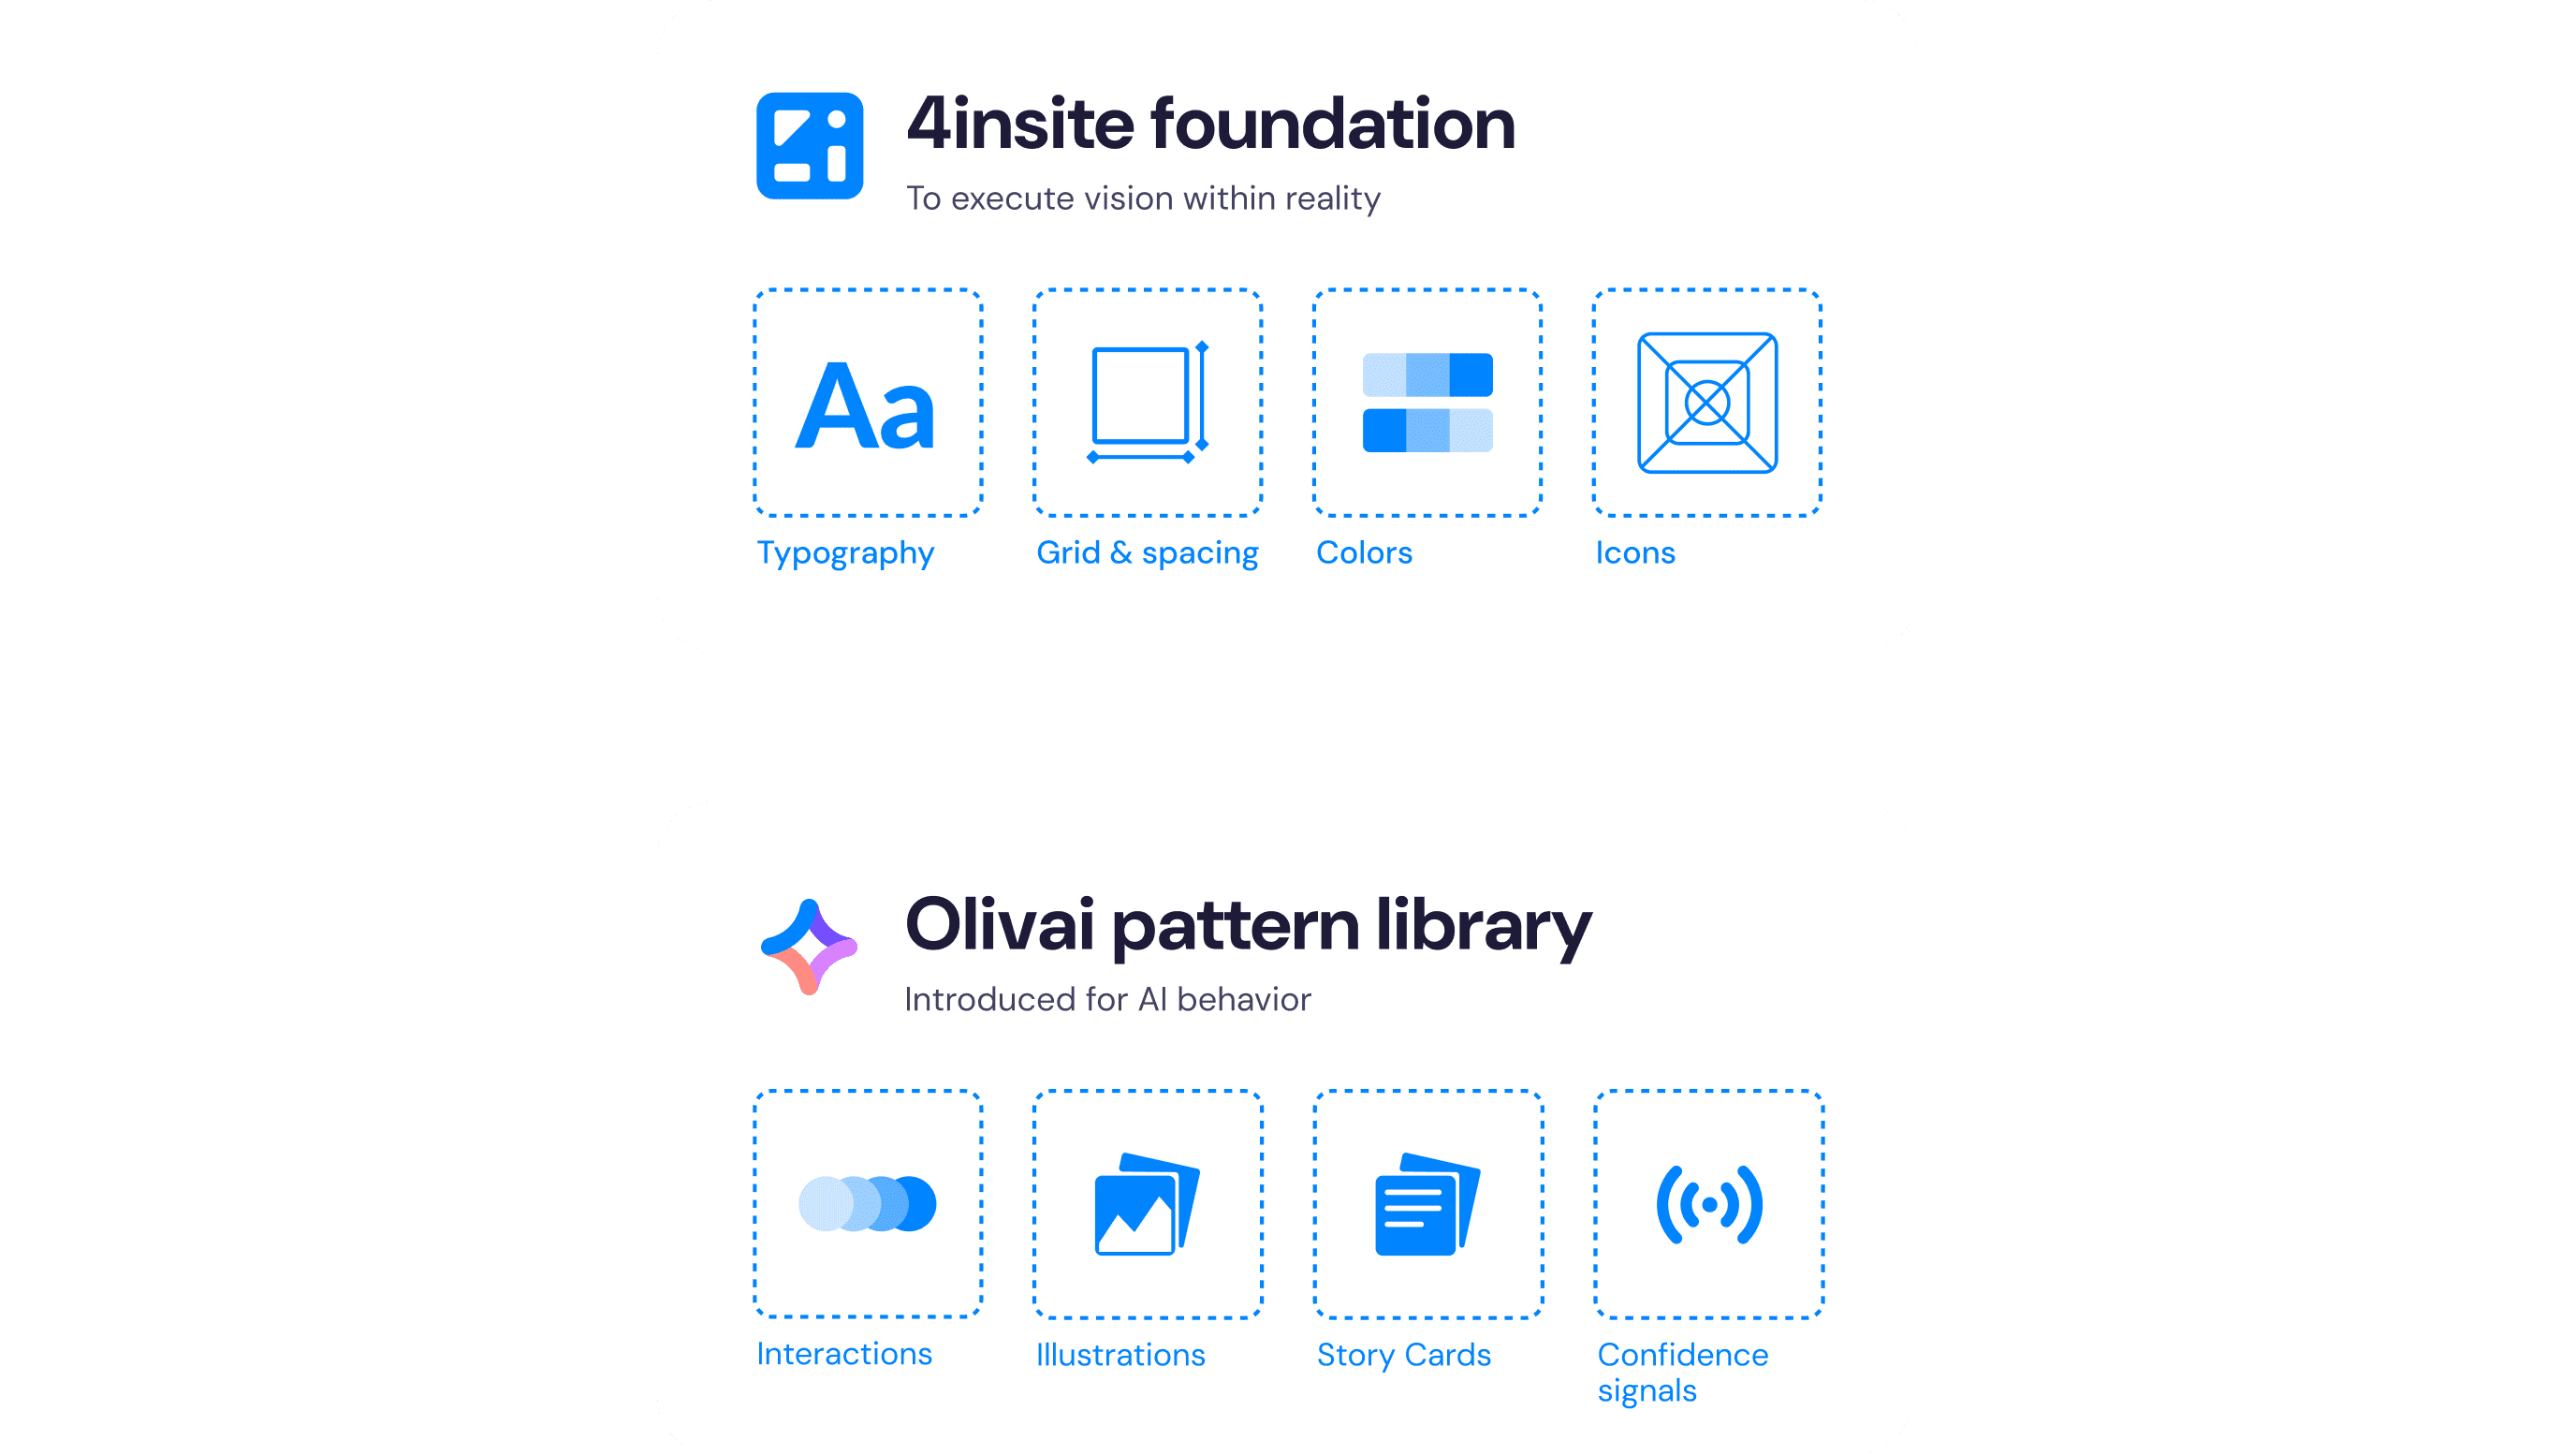
The CEO asked for a standalone brand for OLIVAI. With a 90-day timeline and an active legacy platform running in production, rebuilding the design system from scratch wasn't an option. It also wouldn't have served users anyway.
Instead, I extended 4insite's existing foundation with a new pattern layer: components and interaction models specific to AI guidance, confidence cues, and contextual actions. OLIVAI felt distinct without fragmenting the broader ecosystem or stranding engineering.
01
Chat as persistent entry point
Embedded for constant access within the story dashboard. Available for managers who preferred it, without making it the only path forward.
02
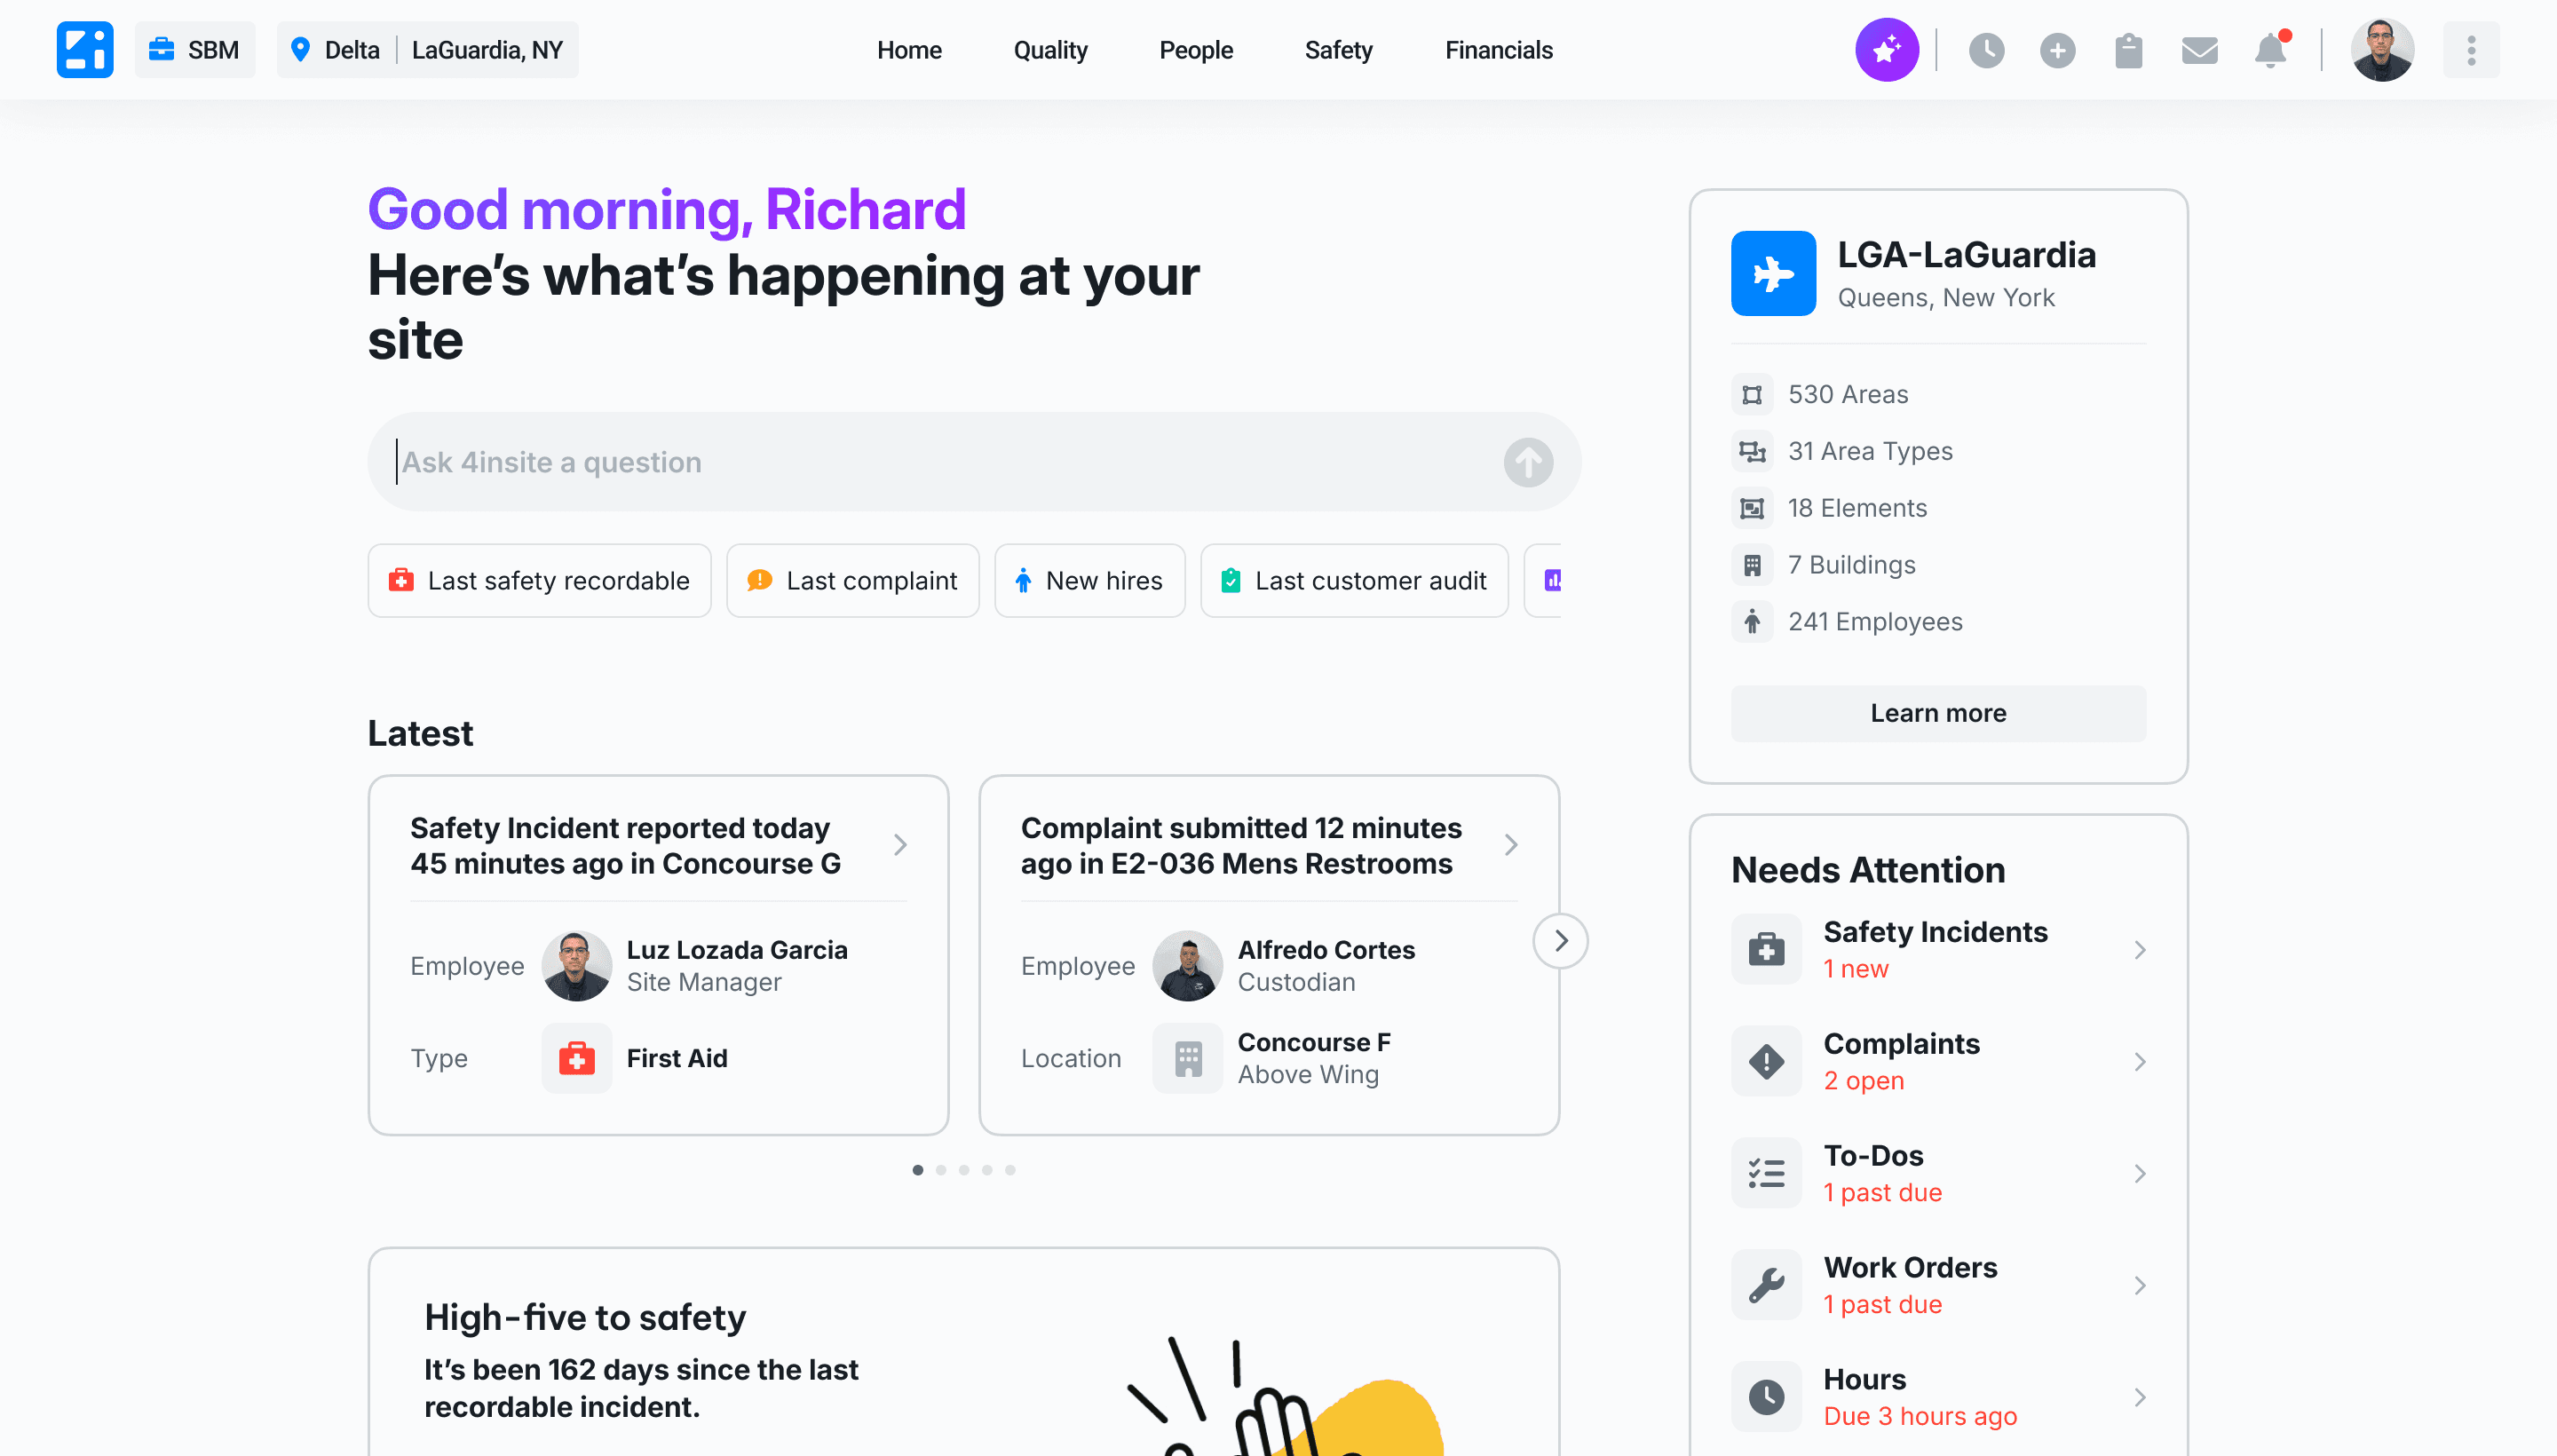
Latest Activity snapshot
A real-time status view designed for fast orientation. Built to answer "what's happening right now" in under 10 seconds.
03
Structured story cards
Narrative summaries built around the trigger → scenario → action mental model. Pre-structured, role-aware, and surfaced without requiring a query.
03
Needs Attention CTAs
Benchmarked, role-specific next actions that replaced the open-ended question "what should I do?" with a direct, contextual answer.
Extended the existing token system with OLIVAI-specific variables. New visual language applied at the component layer, not the foundation, preserving full compatibility with the legacy platform.
A documented library of patterns for AI guidance delivery, confidence cue presentation, and role-aware contextual actions. Built to scale beyond Site Pulse.
11 - Impact
Measured results from the pilot rollout
Site Pulse was tracked through its pilot rollout with a clear metrics framework tied to the original OKRs. The results validated the structured-story approach at every level.
4×
More insights surfaced per session
80%
Users oriented without training
91%
Applied consistent mental model before any training
#1
Blueprint for all future AI initiatives at the org

Beyond the numbers, the organizational impact was structural. For operational teams, the shift from fragmented dashboards to structured stories changed how they engage with data entirely. Internally, the execution model that made Site Pulse possible became a reference framework for every subsequent AI initiative. It defined how the company scopes, validates, and ships AI features within legacy constraints going forward.
12 - Reflection
What I'd think about differently
The strongest decisions on this project came from three places: embracing real constraints rather than designing around them, reshaping information around how managers actually reason rather than how we assumed they would, and treating AI as a tool for guided confidence-building rather than full automation.
If I were starting over, I'd push for quantified behavioral baselines earlier. We validated direction through comparison testing, but having pre-existing session-depth data from the legacy dashboard would have made the story sharper and the business case easier to build from day one.
I'd also position the design system contribution as a first-class deliverable from week one rather than treating it as a parallel workstream. The patterns we built for Site Pulse were valuable enough to be scoped and communicated that way from the start, both internally and for future contracts.